Introduction
Beer is one of the oldest alcoholic beverages and nowadays one of the most popular drinks after water and tea. The raw materials used for brewing beer are water, malted barley, hops and yeast. During the brewing process the carbohydrates from the malted barley are broken down to make a sugar solution (called “wort”), which is used as a source of nutrients for yeast growth. In the fermentation step simple sugars were consumed and ethanol and other flavoring metabolic byproducts are being formed. [1, 2]
The wort composition is essential for beer quality and the presence of proteins, polypeptides, polyphenols and polysaccharides with high molar mass influence its appearance and textural attributes such as haze, foam stability or mouthfeel. [3, 4, 5] Consequently, the analysis of constituents in wort and beer is important for the brewing industry. Here we describe the comprehensive characterization of beer samples using multi-detector Asymmetrical Flow Field-Flow Fractionation coupled with UV-, Multi-Angle Light Scattering, Refractive Index and Fluorescence detection (AF4-UV-MALS-RI-FLD) with only minimal sample preparation requirements. While UV, FLD and RI detection allows for the identification of different molecule classes, MALS enables access to their molar mass distribution providing in-depth information about the macromolecular composition of different beers.
Experimental and Results
Two different local lager beers (HB and StB) were investigated within this study. Both samples were degassed for 20 min in an ultrasonic bath. A volume of 125 μL was injected into the separation channel without any further sample preparation. Phosphate buffered saline, PBS, with a pH of 4.4 was used as eluent. A regenerated cellulose membrane with a cut-off of 10 kDa was installed in the separation channel. The UV detector was used in the dual wavelength mode at 280 nm for detection of proteins and polyphenols and at 320 nm for the detection of polyphenols only. [6] For Fluorescence detection an excitation wavelength of 278 nm and an emission wavelength of 338 nm was chosen for the detection of proteins and probably some polyphenoles. [6] For molar mass calculation of proteins a specific refractive index increment (dn/dc) of 0.185 mL/g and for polysaccharides a dn/dc of 0.147 mL/g was used.
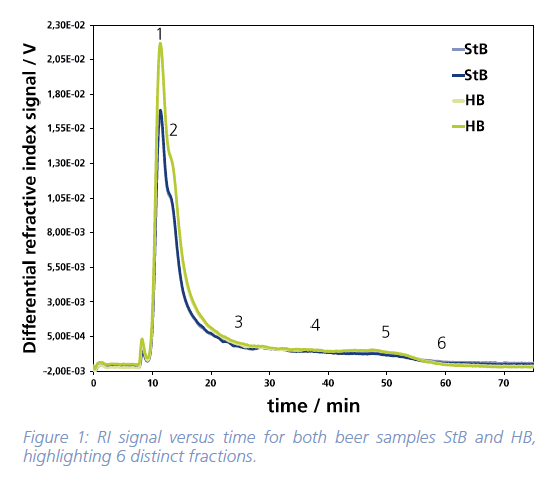
Figure 1 shows the RI signal over time, which is sensitive for all, polyphenoles, polysaccharides and proteins and corresponds to their concentration in the sample. Together with the other detector signals the fractogram can be divided into 6 distinct fractions, as indicated in Figure 1. The concentration of the single fractions is similar for both beer samples, except for fraction 1 and 2, which show a higher amount in sample HB.
From the MALS detector signals together with RI as concentration detector the molar mass can be calculated (see Figure 2) and also the RMS radii (see Figure 3). The molar masses of the macromolecules range from about 25-180 kDa (fraction 1-3) to about 280-8000 kDa (fraction 4-6). In these fractions 4 to 6 the radius of gyration increases from 15 to 100 nm.
Figure 4 displays the UV signal at the absorbance of 280 nm respectively 320 nm. In contrast to the relative unspecific fractogram at 280 nm, at 320 nm mainly the polyphenols cause a signal due to their large network of aromatic structures and can thus be identified. Both beer samples show a similar protein, polysaccharide and polyphenol content, with slightly higher contents in the HB beer sample. The fluorescence detection (Figure 5) shows a significant difference in region 4 with higher protein content for the StB sample.
Conclusion
In this study we demonstrate the great potential of multi-detector AF4 for beer analysis. The easy and straightforward sample preparation with only minimal perturbation allows the comprehensive characterization of its macromolecular ingredients within 1 hour under almost native conditions. Multi-detector AF4 can be used for example for the investigation of beer composition and stability over time, but may also be useful to reveal subtle differences between different beer types and brands. At the end of the measurement fraction collection is also possible for a more detailed analysis of the single sample constituents.
References
[1] M. Nelson, The Barbarian´s Beverage, A History of Beer in Ancient Europe, 1st ed., Taylor and Francis, 2005
[2] R. Willaert, Handbook of food products manufacturing, 1st ed., John Wiley & Sons, 2007.
[3] K. Smart, Brewing Yeast Fermentation Performance, 2nd ed., John Wiley & Sons, 2003.
[4] M. Miedl, M. A. Garcia, C. W. Bamforth, Journal of Agriculture and Food Chemistry, 2005, 53 (26), 10161-5.
[5] C. W: Bamforth, M. Kanauchi, Journal of the Science of Food and Agriculture, 2003, 83 (10), 1045-50.
[6] P. Stam, J. Mutsaers, A. de Bruine-Paulus, W. Heijne, E. Kaal, DSM Biotechnology Center.


